

Figures below are percentage changes only – Ship.Cars doesn’t disclose absolute volumes or rates. Directional signal, not a forecast. Full methodology at the end.
In short
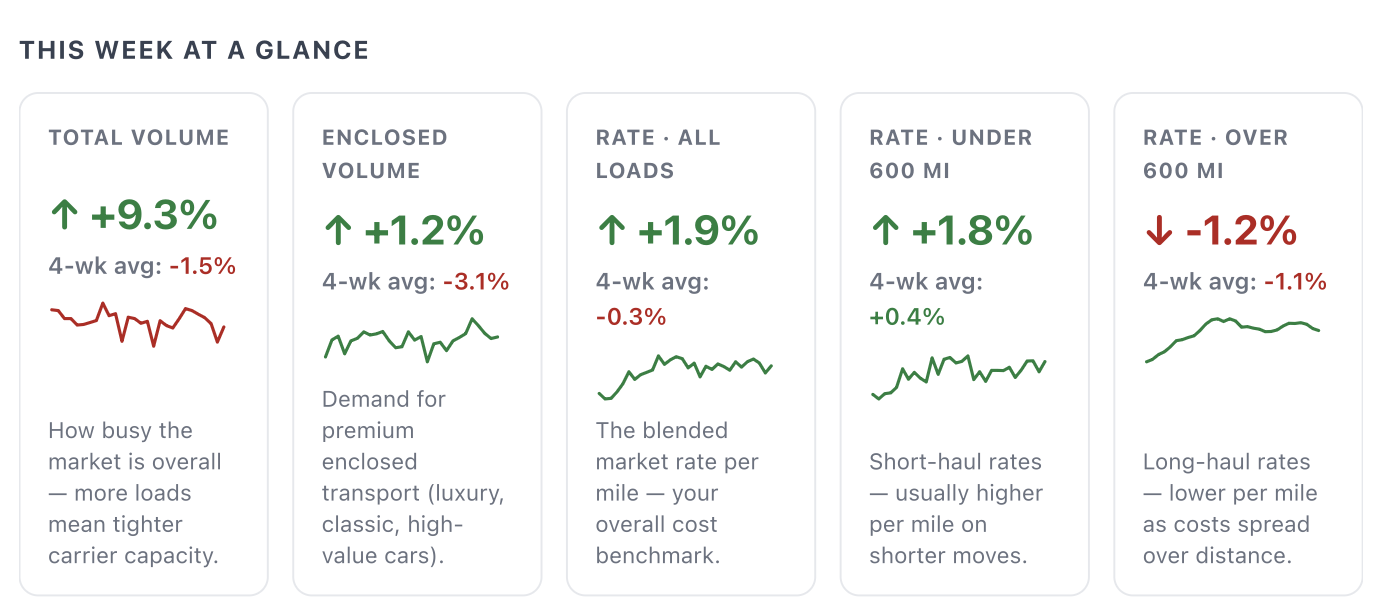
- This week’s auto transport market trends show demand snapped back sharply this week (+9.3% after -10.3%), almost exactly reversing the prior week’s holiday-driven decline – in line with the mechanical rebound pattern seen after comparable holiday weeks earlier in our series. Breadth was the strongest we’ve seen in some time: five of six regions posted solid gains, led by the Northeast and Midwest, while the Northwest was the lone region down on both volume and rate.
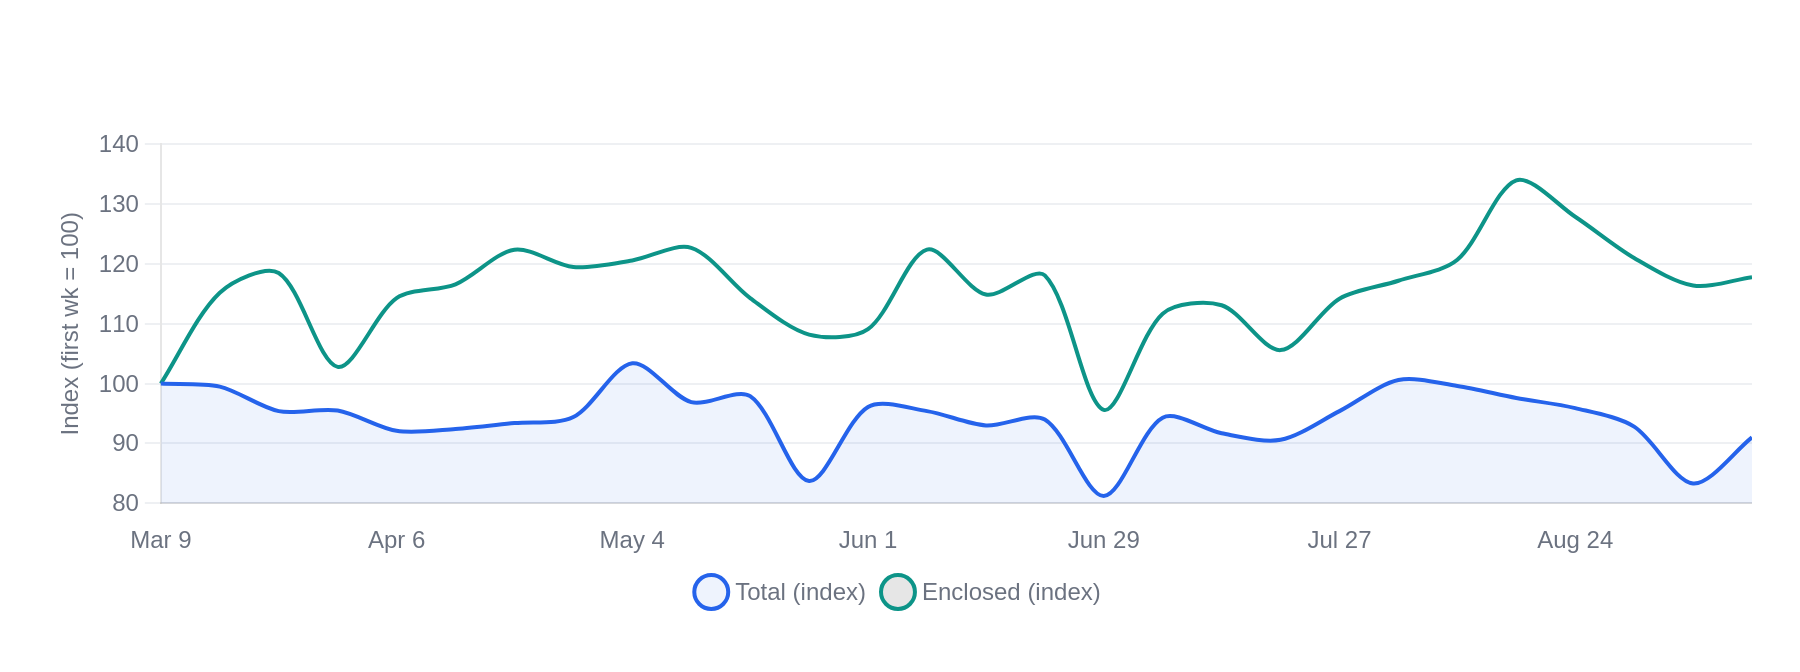
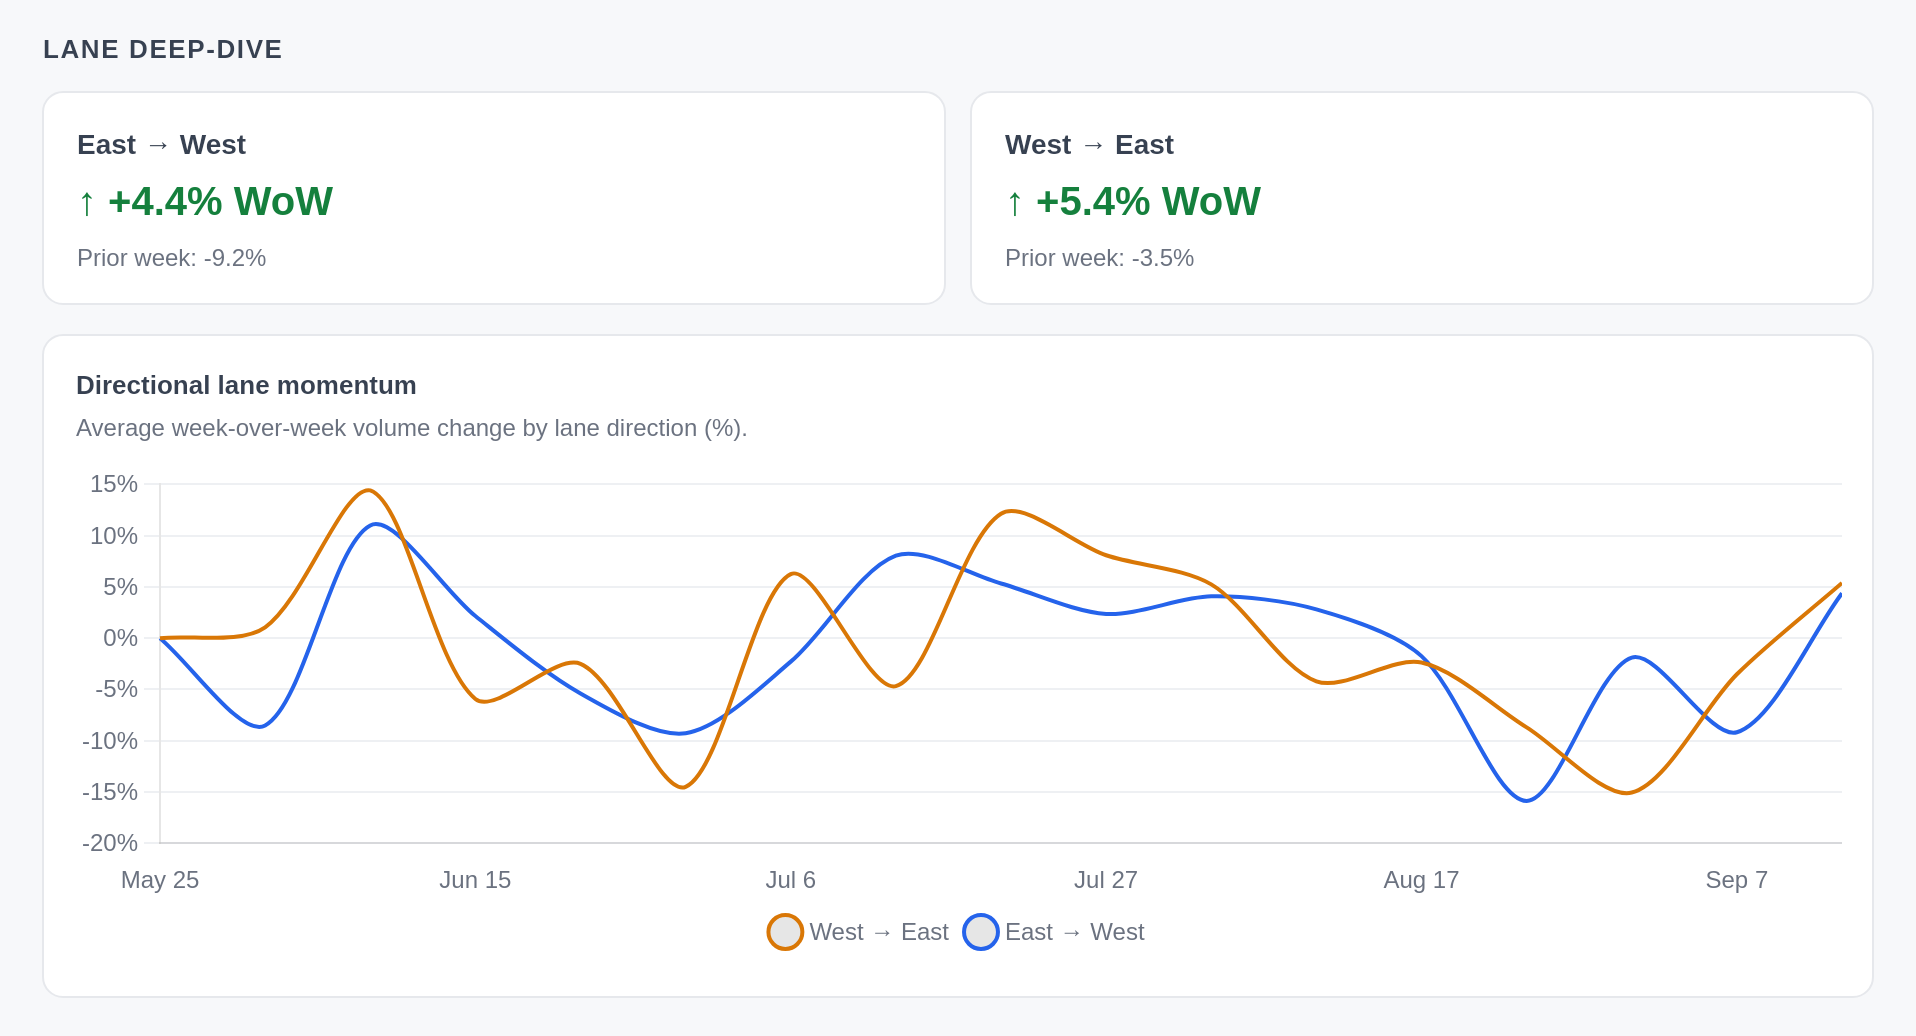
- Rates firmed across most segments we track – blended, short-haul, and enclosed all moved higher – with long-haul the lone segment to ease. The cross-country lanes moved together for the first time in weeks instead of trading places, both posting solid gains – worth watching whether this holds or reverts to the alternating pattern of recent prints.
Volume trend
Pricing trend
Price segment detail
| Segment | WoW | 4-week average |
|---|---|---|
| All loads | ↑ +1.9% | ↓ -0.3% |
| Short-haul · under 600 mi | ↑ +1.8% | ↑ +0.4% |
| Long-haul · over 600 mi | ↓ -1.2% | ↓ -1.1% |
| Enclosed (premium) (volatile) | ↑ +3.3% | ↓ -0.2% |
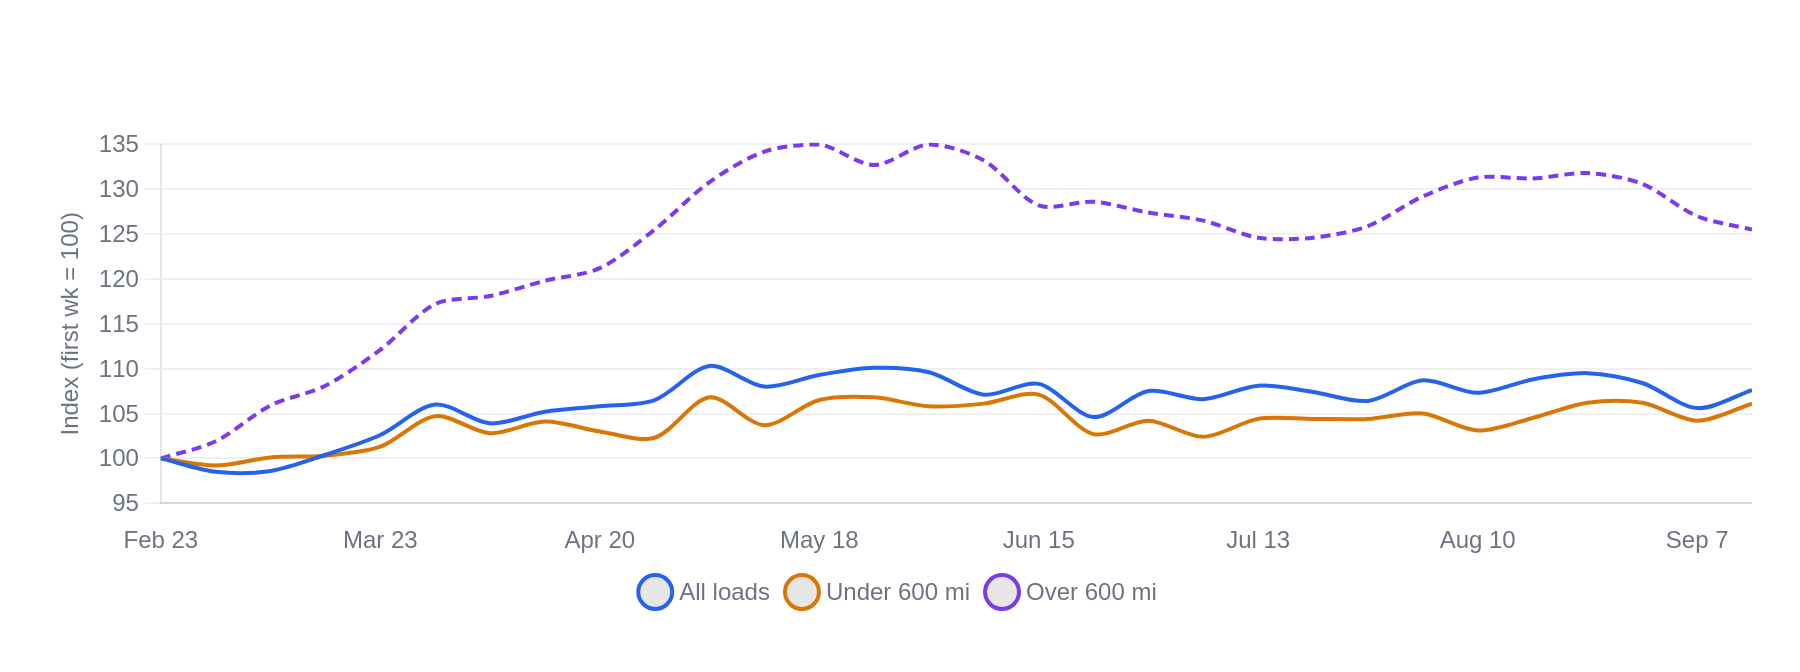
Short-haul rates typically run higher per mile (fixed pickup/delivery effort over fewer miles); long-haul runs lower per mile.
Enclosed (premium) is a small-sample segment, so single weeks can swing for reasons that have nothing to do with the wider market – read it on a multi-week basis rather than week to week. It is excluded from the rate index chart above so that sample noise does not distort the rebased lines.
Lane deep dive
Region deep-dive – volume & rate
Regions: NE – Northeast; SE – Southeast; SW – Southwest; MW – Midwest; NW – Northwest; South – South/South-Central
| Region | Volume WoW | Rate/MI WoW | Volume Trend |
|---|---|---|---|
| MW | ↑ +16.0% | ↑ +2.9% | Improving |
| SE | ↑ +6.1% | ↓ -0.8% | Improving |
| SW | ↑ +9.5% | ↑ +3.9% | Improving |
| NE | ↑ +17.2% | ↓ -1.1% | Improving |
| South | ↑ +5.9% | ↑ +2.5% | Improving |
| NW | ↓ -3.0% | ↓ -6.1% | Weakening |
Volume and rate/mile WoW by region. | Breadth was the strongest in some time: five of six regions advanced on volume, led by the Northeast and Midwest, while the Northwest was the only region down on both measures after being the sole advancer the week before. The trend column compares this week’s volume change with last week’s.
What the data is telling us
- Demand rebounded +9.3% this week, almost exactly reversing the prior week’s -10.3% decline. A national holiday fell inside last week’s reporting window, and the comparable holiday weeks earlier in our series each fully reversed within a week – this week’s print is that mechanical bounce playing out as expected, not a fresh demand signal on its own.
- Regional breadth was the strongest we’ve seen in this series in some time: five of six regions gained, led by the Northeast (+17.2%) and Midwest (+16.0%), with the Southwest (+9.5%), Southeast (+6.1%) and South (+5.9%) also firmly positive.
- The Northwest was the lone region down on both measures – volume -3.0% and rate -6.1% – after being the only region up on both the week before. This region has now round-tripped a spike-and-unwind pattern twice in three weeks; treat it as noisy rather than trending.
- Rates firmed across most segments we track: the blended rate moved +1.9% (-0.3% on four weeks), and short-haul firmed +1.8%. Long-haul was the lone exception, easing -1.2% – a mild pullback after two weeks of broader softening, not yet a new trend on its own.
- The cross-country lanes moved together for the first time in weeks instead of trading places: East→West +4.4% and West→East +5.4%, both positive after last week’s steep East→West decline (-9.2%). Worth watching whether this holds or reverts to the alternating pattern seen since June.
- Premium enclosed volume rose a modest +1.2% – a much softer rebound than the broader market’s +9.3%, consistent with its milder moves during the prior decline too. Its four-week average (-3.1%) remains close to flat, while its rate firmed the most of any segment (+3.3%).
What to watch: This week’s rebound is the calendar effect flagged previously playing out as expected, so treat it as a return to trend rather than a new demand signal. The more encouraging thread is breadth and pricing: five of six regions gained, and rates firmed in three of four segments – both constructive after two softer weeks. Beyond that, watch whether the Northwest’s second reversal in three weeks settles down, whether the cross-country lanes keep moving together instead of alternating, and whether long-haul rates stabilize after a third straight week of softness. For standard open-carrier moves, normal lead times and stable budgeting still apply; for enclosed and high-value vehicles, book earlier.
– Vlad Kadurin, Chief Product & Operations Officer
Methodology: Ship.Cars Market Read reflects marketplace activity for the last complete Monday–Sunday week (September 14 – 20, 2026). Every figure is a week-over-week or 4-week percentage change — absolute volumes and rates are not disclosed. Rate movements are calculated using a distance-adjusted methodology that compares loads within distance bands and limits the influence of extreme per-mile values. Figures are directional indicators, not a forecast, and may be revised as late loads post. Refreshed weekly. For informational purposes only.