
Auto Transport Demand Falls Across All Regions as Rates Decline for the First Time in Weeks — Ship.Cars
Market trends
• 5 min read

Auto Transport Demand Falls Across All Regions as Rates Decline for the First Time in Weeks

Ship.Cars Weekly Pulse | October 5–11, 2026

Written by:

Ship.Cars Team
Ship.Cars Team

Figures below are percentage changes only – Ship.Cars doesn’t disclose absolute volumes or rates. Directional signal, not a forecast. Full methodology at the end.

In short
  • Auto transport demand fell back this week (-5.4% WoW) after last week’s +0.5%, reversing the tentative stabilization seen in last week’s market report. Enclosed demand moved sharply against the trend, +6.0% WoW, partially reversing last week’s record single-week drop.
  • Rates eased across every open-carrier segment for the first time in several weeks: all-loads -3.0%, short-haul -3.3%, long-haul -1.5% (a sixth straight weekly decline), and enclosed -1.1%, ending its three-week run of gains (this segment is thin and volatile).
  • Regional breadth collapsed: all six regions fell on both volume and rate, led by the Northwest (-19.2% volume) and the Northeast (-9.7% volume), which gave back last week’s gain entirely. Lanes pulled back together: East→West reversed hard (-9.5%) after last week’s rebound, while West→East deepened its decline (-4.1%).
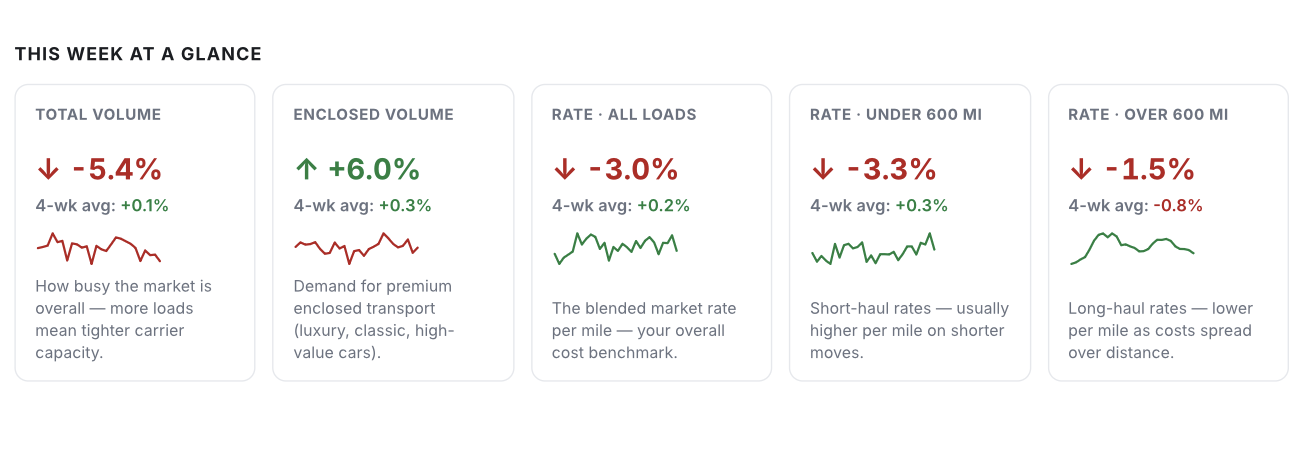
Each figure is a percentage change – WoW = vs. the prior week; 4-wk avg = average weekly change over the last four weeks (smooths one-week holiday swings). Sparkline shows the rebased trend (relative, not absolute).

Volume trend

Auto transport demand trends showing declining total load volume and a rebound in enclosed transport demand during the week of October 5–11, 2026.
Volume index – total vs. enclosed | Rebased so the first week shows 100.

Pricing trend

Rate index by segment | Rebased so the first week shown = 100 (all loads, short-haul <600 mi, long-haul >600 mi)

Price segment detail

SegmentWoW4-week average
All loads↓ -3.0%↑ +0.2%
Short-haul · under 600 mi↓ -3.3%↑ +0.3%
Long-haul · over 600 mi↓ -1.5%↓ -0.8%
Enclosed (premium) (volatile)↓ -1.1%↑ +1.0%

Short-haul rates typically run higher per mile (fixed pickup/delivery effort over fewer miles); long-haul runs lower per mile.

Enclosed (premium) is a small-sample segment, so single weeks can swing for reasons that have nothing to do with the wider market – read it on a multi-week basis rather than week to week. It is excluded from the rate index chart above so that sample noise does not distort the rebased lines.

Lane deep dive

Region deep-dive – volume & rate

Regions: NE – Northeast; SE – Southeast; SW – Southwest; MW – Midwest; NW – Northwest; South – South/South-Central

RegionVolume WoWRate/MI WoWVolume Trend
MW↓ -0.3%↓ -3.1%Improving
South↓ -3.4%↓ -2.6%Weakening
SE↓ -4.8%↓ -2.5%Weakening
SW↓ -5.3%↓ -0.5%Weakening
NE↓ -9.7%↓ -3.3%Weakening
NW↓ -19.2%↓ -1.9%Weakening

Volume and rate/mile WoW by region. | All six regions declined on both volume and rates, reversing last week’s mixed performance. The Northwest saw the sharpest drop in volume, while the Northeast also weakened significantly. The Midwest remained relatively stable in volume but experienced one of the steepest rate declines.

Volume index by region | Built by compounding each region’s weekly % change. Rebased so the first week shown = 100. This only shows direction and relative momentum, not size.
Rate index by region | Average price per mile by region. Rebased so the first week shown = 100. Relative movement only.

What the data is telling us

  • Auto transport demand fell -5.4% WoW after last week’s +0.5% print, snapping what had looked like a stabilizing trend. The four-week average weekly change is now +0.1%.
  • Enclosed volume rebounded +6.0%, partially reversing last week’s record single-week drop. Its four-week average is now +0.3% – a partial bounce rather than a reversal of the underlying softness.
  • Rates eased across every open-carrier segment for the first time in several weeks: all-loads -3.0%, short-haul -3.3%. Long-haul extended its decline to a sixth straight week (-1.5%). Enclosed rates broke their three-week winning streak (-1.1%), though this segment is thin and volatile and should be read with caution.
  • Regional breadth collapsed: all six regions fell on volume this week – Northwest -19.2%, Northeast -9.7%, Southwest -5.3%, Southeast -4.8%, South -3.4%, Midwest -0.3% – a full reversal from last week’s three-of-six gainers. Rates fell everywhere too, led by the Northeast (-3.3%) and Midwest (-3.1%).
  • The Northeast gave back last week’s gain in full (-9.7% volume, -3.3% rate). The Northwest posted its steepest decline of the window (-19.2% volume, -1.9% rate) – its lowest weekly volume in the visible series.
  • Lanes moved together for once: East→West reversed hard (-9.5%) after last week’s rebound, while West→East deepened its decline (-4.1%). Both lanes are now negative for the first time in three weeks.

What to watch: This week looks like a broad-based pullback rather than a continuation of any single trend – volume, rates and regional breadth all reversed together. Enclosed’s rebound is worth watching: a genuine recovery, or a one-week bounce before the softer trend reasserts? Long-haul rates remain the softest spot, now down six straight weeks. Watch whether the Northwest’s steep drop is a one-off, whether the Northeast re-finds its footing, and whether the lanes’ synchronized decline persists or reverts to their usual divergence.

– Polina Shurlieva, Product Owner, Carrier Products

Methodology: Ship.Cars Market Read reflects marketplace activity for the last complete Monday–Sunday week (October 5–11, 2026). Every figure is a week-over-week or 4-week percentage change — absolute volumes and rates are not disclosed. Rate movements are calculated using a distance-adjusted methodology that compares loads within distance bands and limits the influence of extreme per-mile values. Figures are directional indicators, not a forecast, and may be revised as late loads post. Refreshed weekly. For informational purposes only.

Share the article: