

Figures below are percentage changes only – Ship.Cars doesn’t disclose absolute volumes or rates. Directional signal, not a forecast. Full methodology at the end.
Methodology note: The rate series has been recalculated across the full historical period using an updated methodology designed to reduce distortions caused by changes in trip-length mix and extreme per-mile values. Loads are now compared within distance bands and combined using a consistent weighting, so shifts between short-, regional- and long-haul freight do not move the headline rate on their own. Extreme $/mile observations are also limited to reduce the influence of outliers. As a result, the refreshed rate series is smoother and may differ materially from figures shown in earlier reports. Volume data is unchanged. Rate movements in this report and going forward should therefore be read on the updated basis rather than compared directly with previously published rate levels.
In short
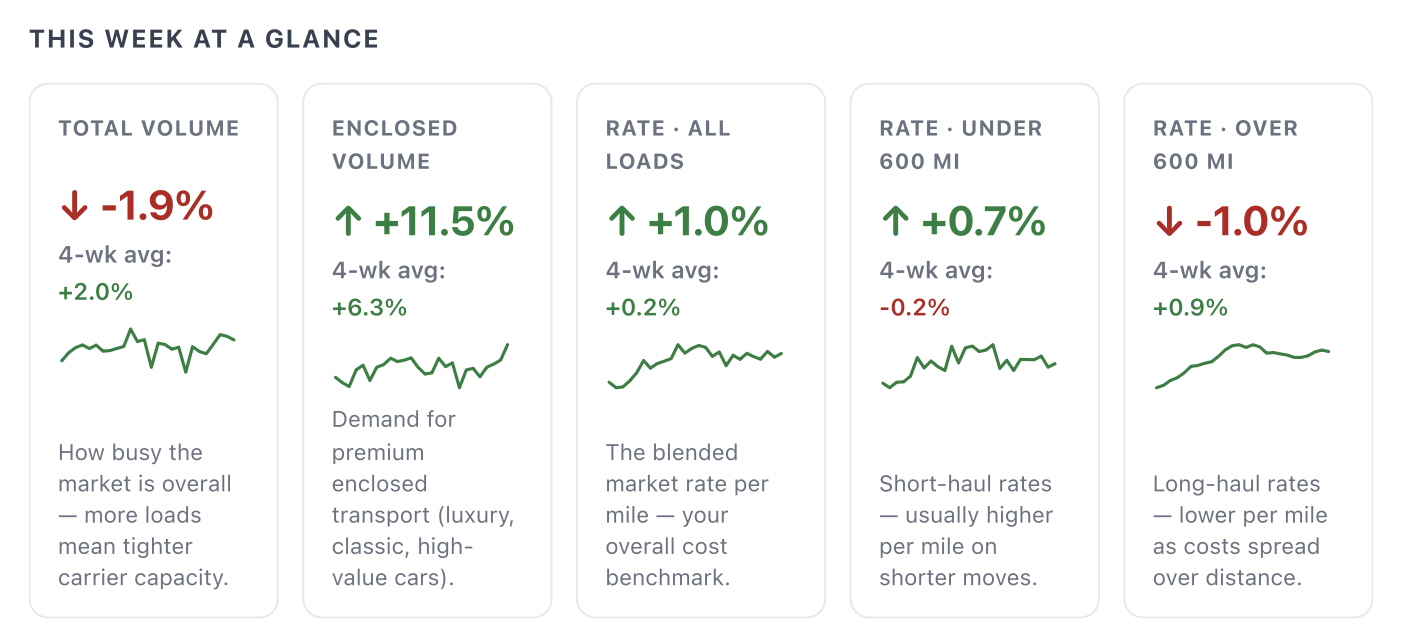
- Overall demand eased a second week (-1.9% after -0.9%), a shallow give-back that still leaves August comfortably ahead of the July baseline – the four-week trend remains positive. Auto transport rates were flat across the board: the blended rate rose about a point, short-haul was similarly quiet, and long-haul edged lower after firming through early August. On a four-week view every rate segment is within a point of unchanged, so the cost picture is stable rather than tightening.
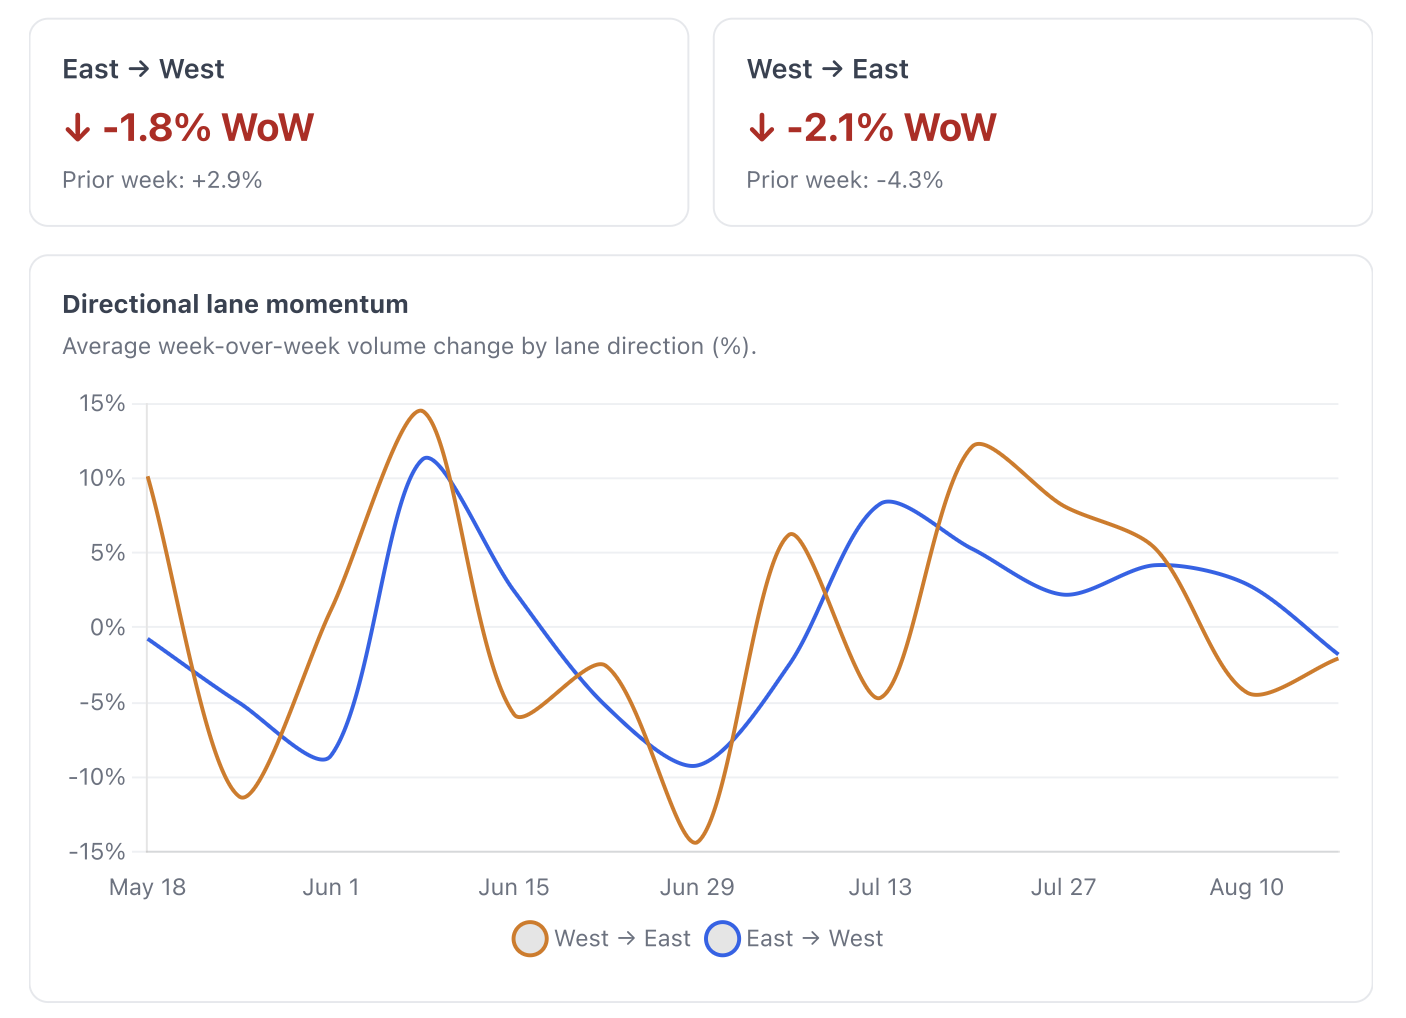
- The clearer story is in the premium segment: enclosed volume rose by double digits and has now gained four weeks running, its strongest reading of the year and a visibly faster climb than the open market. Regional breadth narrowed sharply – only the Northwest advanced, and its per-mile rate fell as its volume jumped, which points to a shift in load mix rather than a demand surge. Both coast-to-coast directions turned negative together for the first time since early July, so directional momentum has flattened rather than rotated.
Volume trend
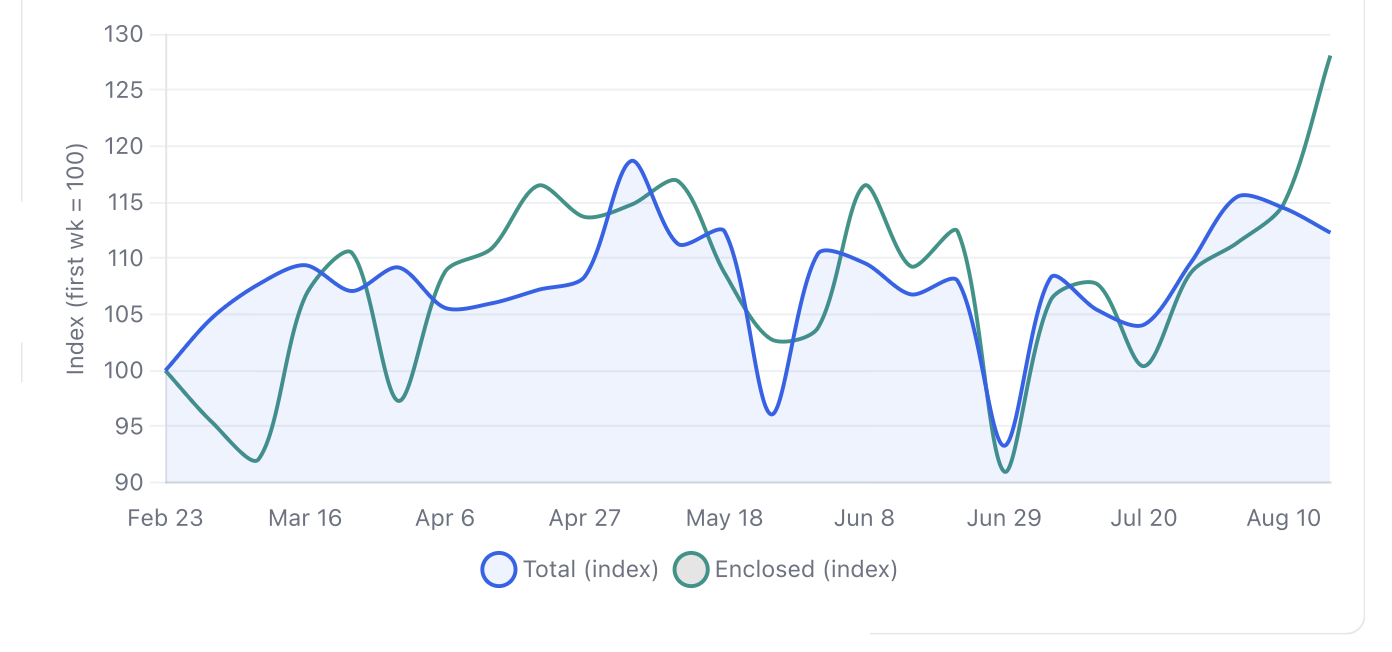
Pricing trend
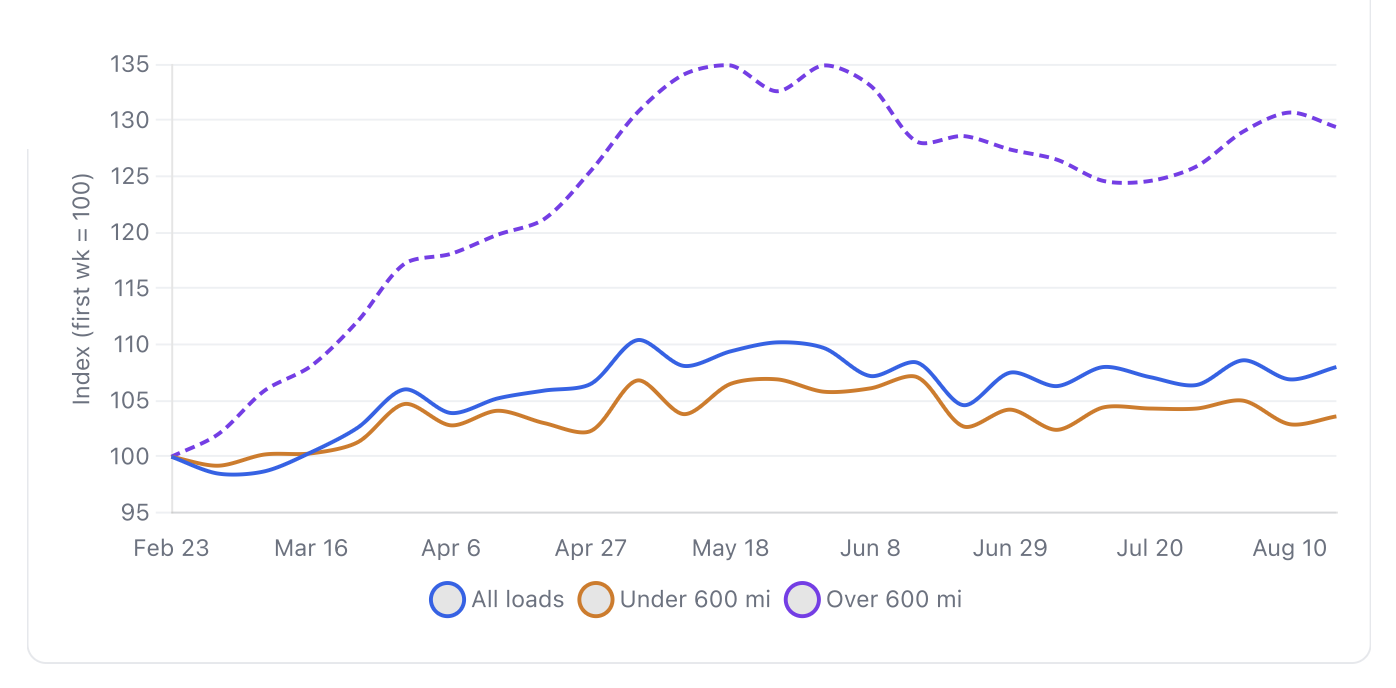
Price segment detail
| Segment | WoW | 4-week average |
|---|---|---|
| All loads | ↑ +1.0% | ↑ +0.2% |
| Short-haul · under 600 mi | ↑ +0.7% | ↓ -0.2% |
| Long-haul · over 600 mi | ↓ -1.0% | ↑ +0.9% |
| Enclosed (premium) (volatile) | ↑ +2.2% | ↑ +1.1% |
Short-haul rates typically run higher per mile (fixed pickup/delivery effort over fewer miles); long-haul runs lower per mile.
Enclosed (premium) rate per mile is based on a much smaller pool of high-value loads, so it can swing sharply week to week – read the 4-week trend rather than any single week. It is excluded from the rate index above to avoid distorting the chart.
Note also that the underlying rate series was revised at source in this refresh across all historical weeks, onto a smoother basis; the large blended-rate move shown on the prior version of this board did not survive that revision, and the corrected reading is broadly flat. Rate figures remain directional and may be revised as late loads post.
Lane deep dive
Region deep-dive – volume & rate
Regions: NE – Northeast; SE – Southeast; SW – Southwest; MW – Midwest; NW – Northwest; South – South/South-Central
| Region | Volume WoW | Rate/MI WoW | Volume Trend |
|---|---|---|---|
| NW | ↑ +37.7% | ↓ -6.1% | Improving |
| South | ↓ -1.3% | ↑ +3.1% | Weakening |
| MW | ↓ -1.4% | ↓ -1.7% | Weakening |
| SW | ↓ -1.4% | ↑ +0.6% | Improving |
| NE | ↓ -5.0% | ↓ -1.0% | Weakening |
| SE | ↓ -10.0% | ↑ +2.3% | Weakening |
Volume and rate/mile WoW by region. | Breadth narrowed to a single advancing region: the Northwest rebounded strongly off a soft prior week, while the other five all declined – the Southeast by double digits after a positive week, the Northeast mid-single digits, and the Midwest, Southwest and South each roughly a point lower. Regional rates split evenly, three up and three down, with no single region distorting the blend: the South and Southeast firmed modestly while the Northwest gave back the most. The Northwest pairing is worth noting – volume up sharply while its per-mile rate fell – which usually indicates a change in the mix of loads moving rather than a genuine demand shift. Where rates firm while volume falls, as in the Southeast, the more common explanation is capacity leaving the market. The trend column compares this week’s volume change with last week’s.
What the data is telling us
- Demand softened for a second week (-1.9% after -0.9%), so the early-August step-up has peaked and is easing back rather than accelerating. The four-week average is still positive (+2.0%), and the level remains well clear of the late-July low, so capacity should feel similar to last week – modestly easier, not loose.
- Auto transport rates are the quietest they have looked in weeks. The blended rate rose +1.0% on a four-week average of +0.2%, short-haul under 600 mi moved +0.7% (-0.2% on four weeks), and long-haul over 600 mi eased -1.0% after three straight weeks of gentle firming. Every segment is within roughly a point of flat on a four-week view – for anyone budgeting, this is a stable pricing environment, not a rising one.
- Enclosed (premium) transport is the standout: volume rose +11.5%, a fourth consecutive gain and the segment’s strongest reading of the year, with a four-week average of +6.3%. Premium demand is now climbing faster than the open market – if you move high-value or enclosed-only vehicles, book earlier and expect less slack in that pool than the headline volume number implies.
- Regional breadth narrowed to one. Only the Northwest advanced (+37.7%), and it did so directly after a negative week while its own per-mile rate fell (-6.1%) – a low-base rebound with a changed load mix, not a westward shift in demand. Every other region declined: the Southeast (-10.0%) gave back its prior gain, the Northeast (-5.0%) turned down, and the Southwest (-1.4%), Midwest (-1.4%) and South (-1.3%) each eased slightly.
- Both coast-to-coast directions fell together for the first time since early July. East→West turned negative (-1.8%) after five straight positive weeks, and West→East extended its decline (-2.1%). Momentum has flattened rather than rotated between coasts – neither direction is pulling capacity right now, which generally means slightly better availability on long-distance moves in either direction.
- Where rates did move, the pattern was mild and offsetting: the South (+3.1%) and Southeast (+2.3%) firmed while the Northwest (-6.1%) and Midwest (-1.7%) eased. With no region dominating the blend this week, the flat headline is a fair representation of the market rather than an average masking extremes.
- The enclosed rate edged up +2.2% even as enclosed volume rose by double digits, so premium capacity is absorbing the additional demand without meaningful price pressure so far. This is a small-sample segment, so read it across several weeks rather than on any single print.
What to watch: Two weeks of gentle volume decline alongside flat rates across every segment describes a market consolidating after its August run, not turning. The exception is premium: enclosed demand has climbed four weeks in a row to its strongest level of the year, and that is the one place where waiting is likely to cost you availability. Into early September, the questions are whether enclosed holds its new high or the run proves to be a pull-forward, whether the Northwest’s rebound sticks or mean-reverts as prior western spikes have, and whether long-haul’s small decline is the start of a turn or just noise inside a flat range. For standard open-carrier moves the current picture supports normal lead times and stable budgeting; for enclosed and high-value moves, book earlier.
– Daniel Mihaylov, Product Manager, Carrier Products
Methodology: Ship.Cars Market Read reflects marketplace activity for the last complete Monday–Sunday week (August 17 – 23, 2026). Every figure is a week-over-week or 4-week percentage change — absolute volumes and rates are not disclosed. Figures are directional indicators, not a forecast, and may be revised as late loads post. Refreshed weekly. For informational purposes only.