

Figures below are percentage changes only – Ship.Cars doesn’t disclose absolute volumes or rates. Directional signal, not a forecast. Full methodology at the end.
In short
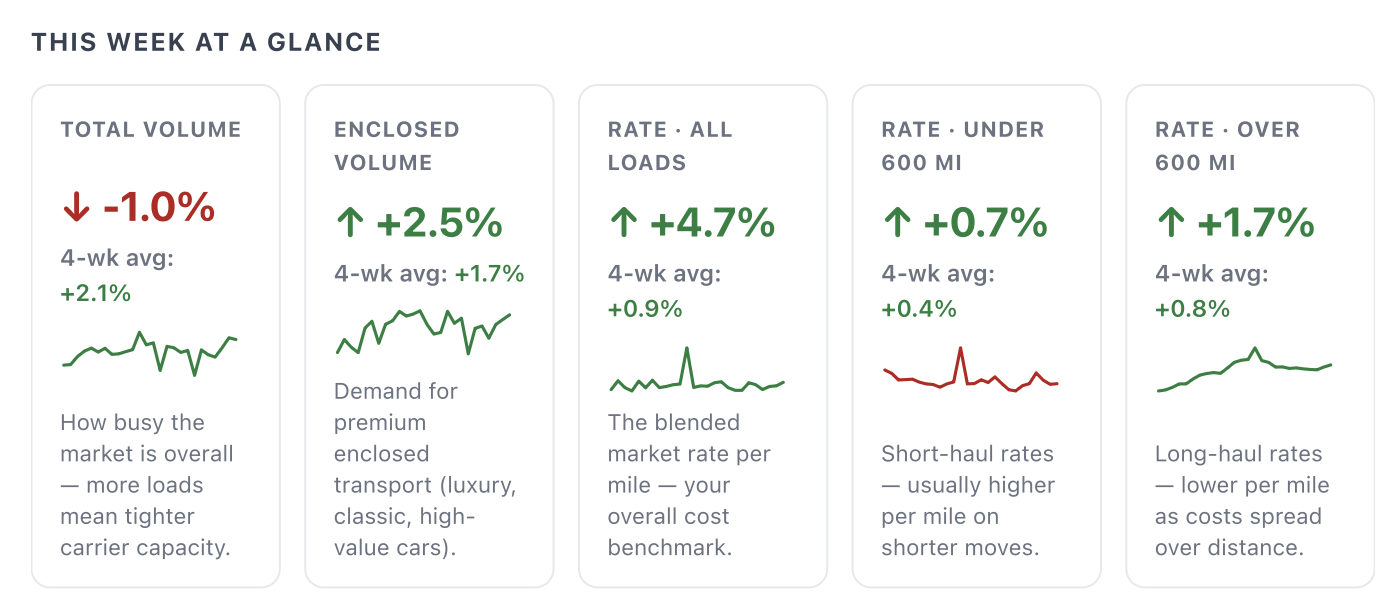
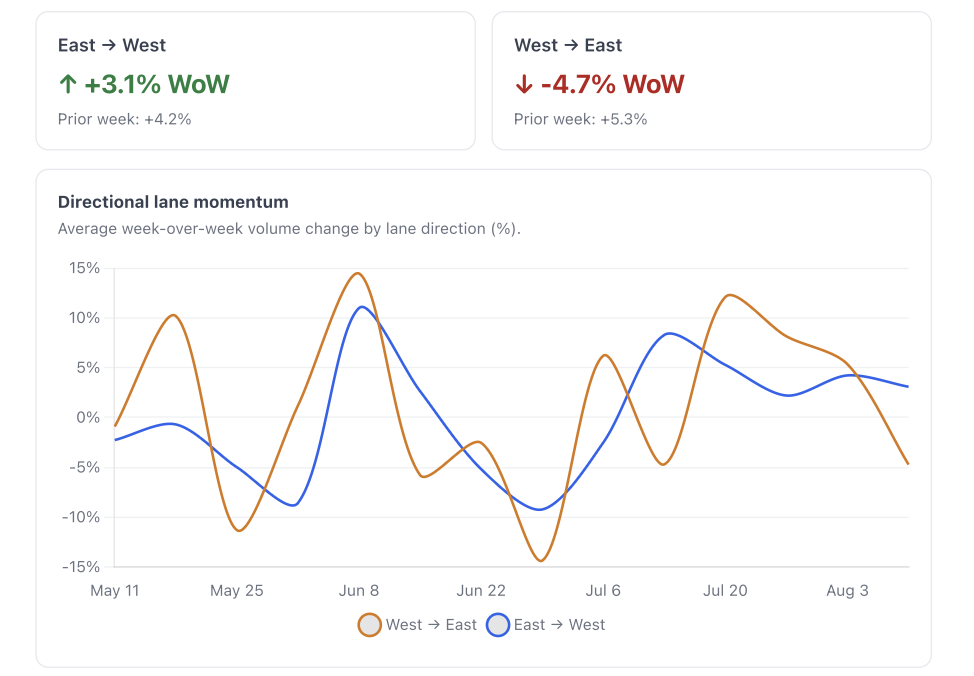
- The two-week climb paused without unwinding: total volume eased -1.0% after back-to-back mid-single-digit gains, leaving demand well above the July baseline. Underneath, the map split for the first time in three weeks – the Southeast and Midwest kept advancing and the Northeast held marginally positive, while the two western regions handed back their prior-week surges with high-single-digit declines. Lane direction split with it: eastbound-to-west flows stayed positive for a fifth straight week while west-to-east turned negative after three gains.
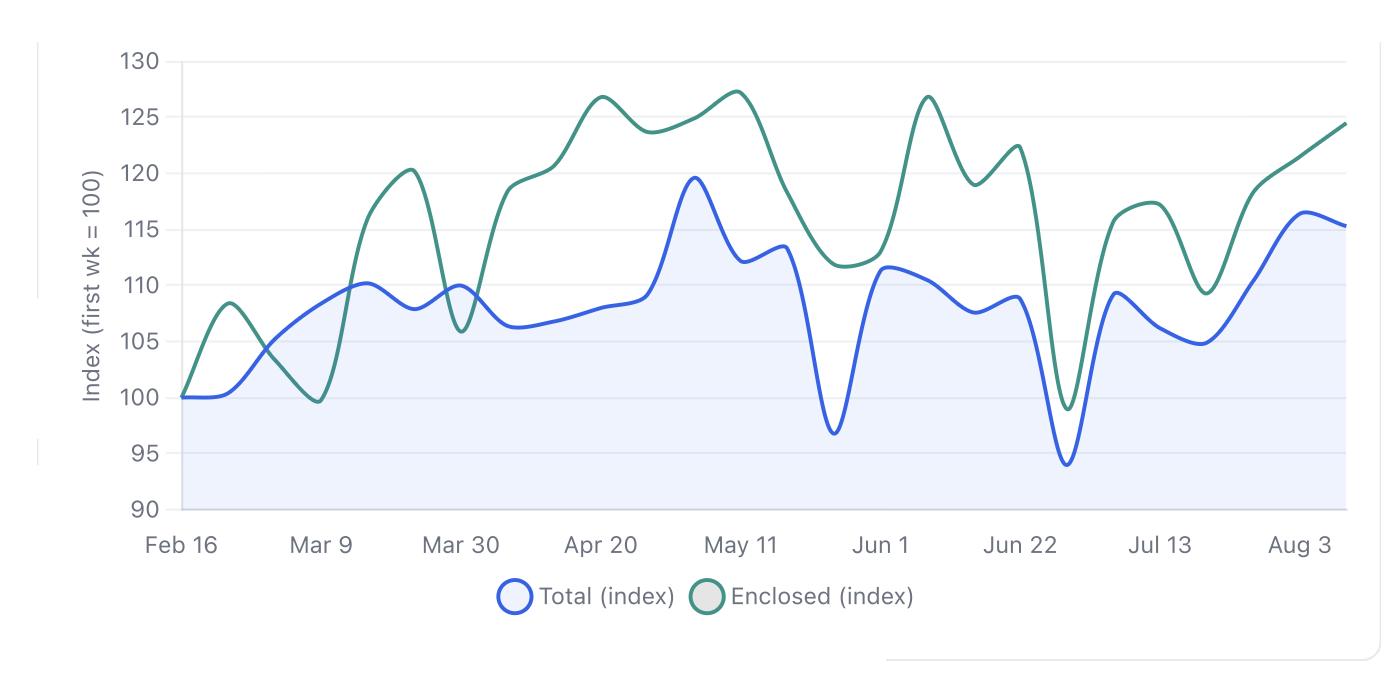
- Auto transport rates, notably, firmed anyway – the blended rate rose +4.7% and, unlike last week, both haul segments moved up together, so the gain reflects genuine firming rather than load mix alone. Enclosed demand posted a third consecutive gain.
Volume trend
Pricing trend
Price segment detail
| Segment | WoW | 4-week average |
|---|---|---|
| All loads | ↑ +4.7% | ↑ +0.9% |
| Short-haul · under 600 mi | ↑ +0.7% | ↑ +0.4% |
| Long-haul · over 600 mi | ↑ +1.7% | ↑ +0.8% |
| Enclosed (premium) (volatile) | ↓ -3.2% | ↓ -1.6% |
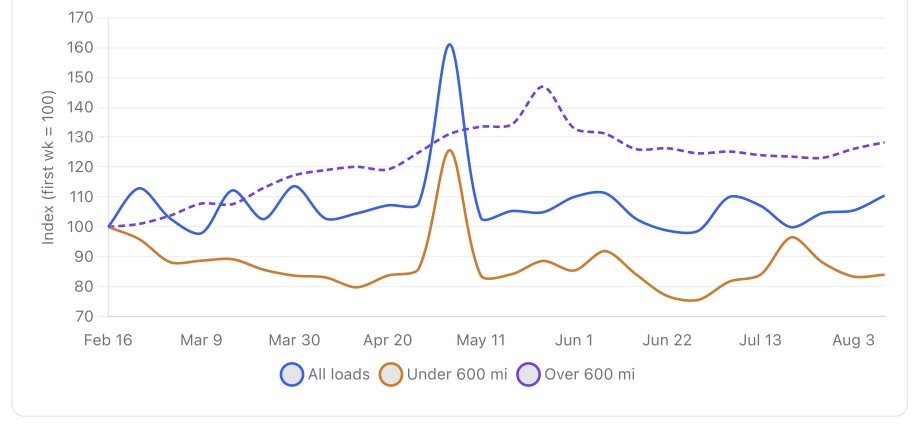
Short-haul rates typically run higher per mile (fixed pickup/delivery effort over fewer miles); long-haul runs lower per mile.
Enclosed (premium) rate per mile is based on a much smaller pool of high-value loads, so it can swing sharply week to week – read the 4-week trend rather than any single week. It is excluded from the rate index above to avoid distorting the chart.
Lane deep dive
Region deep-dive – volume & rate
Regions: NE – Northeast; SE – Southeast; SW – Southwest; MW – Midwest; NW – Northwest; South – South/South-Central
| Region | Volume WoW | Rate/MI WoW | Volume Trend |
|---|---|---|---|
| SE | ↑ +4.2% | ↑ +6.6% | Weakening |
| MW | ↑ +2.3% | ↑ +18.8% | Improving |
| NE | ↑ +1.1% | ↑ +5.9% | Weakening |
| South | ↓ -0.9% | ↓ -8.6% | Weakening |
| SW | ↓ -7.2% | ↓ -3.0% | Weakening |
| NW | ↓ -9.2% | ↑ +16.0% | Weakening |
Volume and rate/mile WoW by region. | Three regions grew and three declined – the first split map in three weeks. The Southeast led on volume and the Midwest accelerated, while the Northwest and Southwest reversed hard after last week’s double-digit and near-double-digit jumps. Rates moved largely the other way: the Midwest and Northwest posted the biggest per-mile increases despite flat or falling volume, which typically signals capacity leaving those markets rather than demand pulling rates up. The South was the one region softer on both counts. The trend column compares this week’s volume change with last week’s.
What the data is telling us
- Demand cooled only slightly (-1.0%) after two consecutive mid-single-digit gains, so the August step-up is holding rather than reversing. On a four-week view the trend is still clearly positive (+2.1% average weekly change). Expect capacity to feel roughly as tight as last week, not looser.
- The regional map split three-and-three for the first time since late July. The Southeast (+4.2%) stayed out front and the Midwest (+2.3%) accelerated, with the Northeast (+1.1%) just positive. The South edged down (-0.9%), while the Southwest (-7.2%) and Northwest (-9.2%) gave back nearly all of their prior-week surges – those spikes read as one-week events, not a shift westward.
- Lane direction decoupled. East→West held positive (+3.1%) for a fifth straight week, while West→East swung negative (-4.7%) after three consecutive gains. That lines up with the western volume pullback: the flow leaving the West is what softened, and if you’re moving eastbound out of the West you may find slightly easier availability.
- The blended rate firmed +4.7% – the strongest weekly move in roughly two months – with a clear split by region. The Midwest (+18.8%) and Northwest (+16.0%) led on per-mile pricing, followed by the Southeast (+6.6%) and Northeast (+5.9%); the Southwest (-3.0%) and South (-8.6%) were the exceptions, both softer.
- This week’s rate move is better-founded than last week’s. Short-haul under 600 mi rose +0.7% and long-haul over 600 mi rose +1.7% – both segments up together, rather than a blended figure lifted by a shift in load mix. Long-haul has now firmed in three of the last four weeks, which is the more meaningful trend for anyone budgeting cross-country moves.
- Enclosed (premium) volume added +2.5%, a third consecutive gain and the segment’s strongest stretch since early June – premium demand is tracking the broader market rather than lagging it. The enclosed rate eased (-3.2%), so that demand is being absorbed without price pressure, though this is a small-sample segment best read over several weeks.
What to watch: A near-flat volume week with rates firming across both haul lengths is a steadier signal than a single strong headline – it suggests the market is consolidating its August gains rather than spiking. Into late August, the questions are whether the western regions stabilise or keep unwinding, whether West→East recovers or the eastbound tilt persists, and whether long-haul rates keep building. If you’re planning longer moves, the current firming trend argues for booking earlier rather than waiting for a softer window.
– Vlad Kadurin, Chief Product & Operations Officer
Methodology: Ship.Cars Market Read reflects marketplace activity for the last complete Monday–Sunday week (August 10 – 16, 2026). Every figure is a week-over-week or 4-week percentage change — absolute volumes and rates are not disclosed. Figures are directional indicators, not a forecast, and may be revised as late loads post. Refreshed weekly. For informational purposes only.