

This monthly market read looks at public economic and transportation signals through the lens of auto logistics, translating them into practical context for pricing, capacity, and planning.
Key takeaways
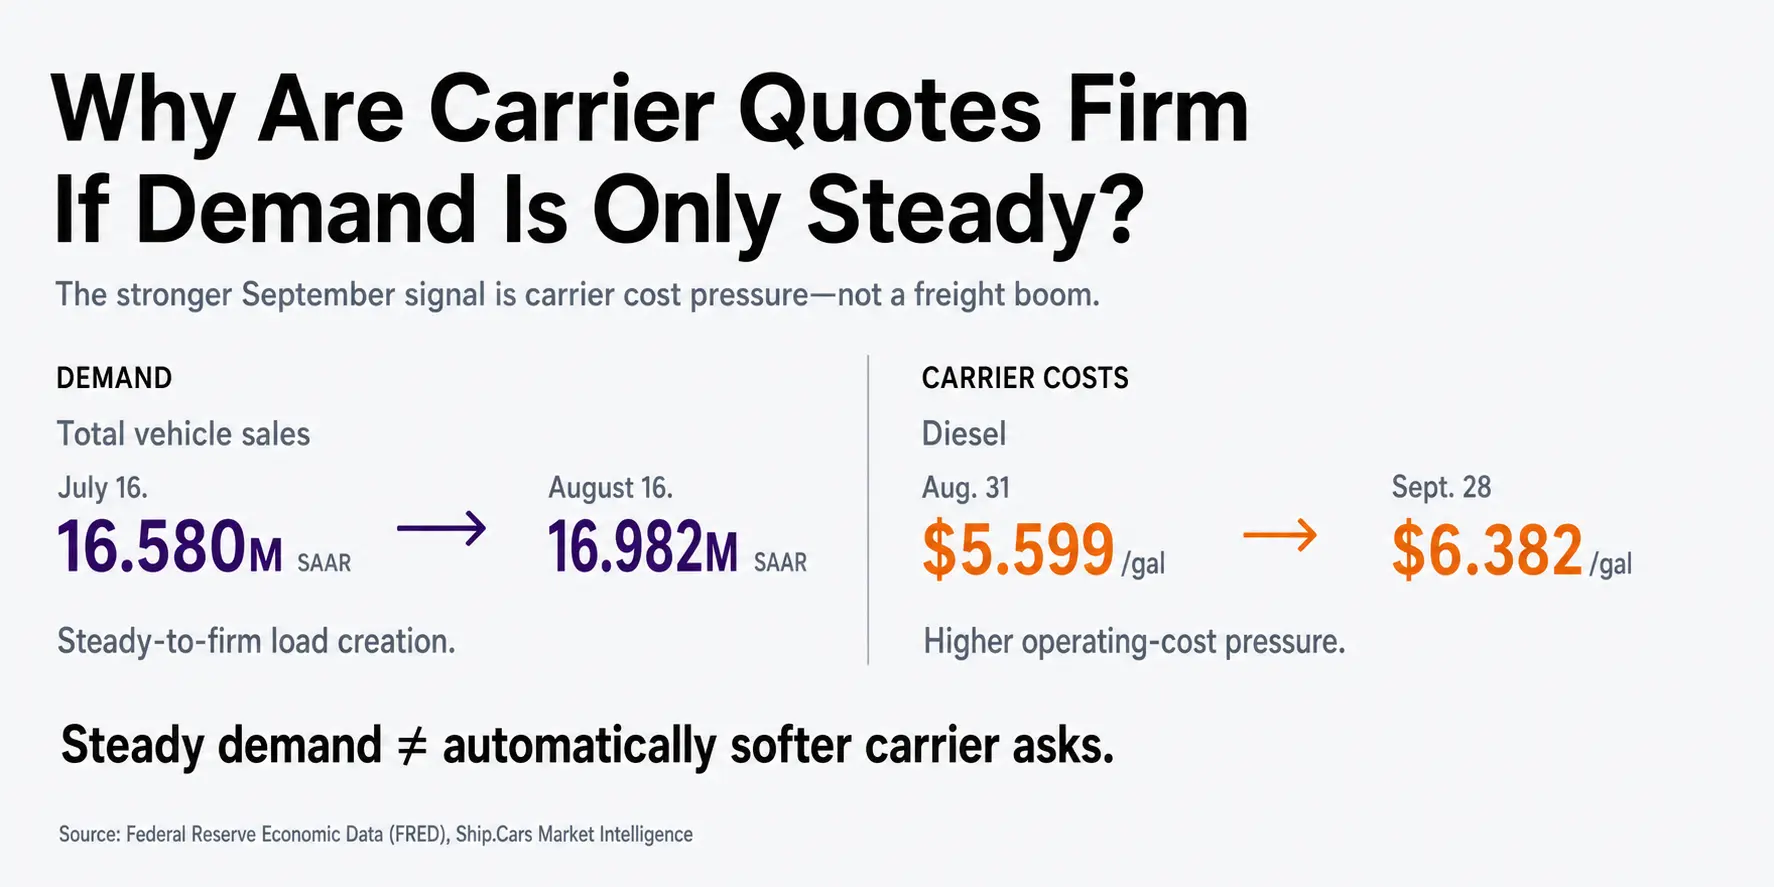
- Auto transport prices are staying firm even as demand remains steady. Total vehicle sales increased from a 16.580 million SAAR pace in July to 16.982 million in August, supporting regular vehicle movement without pointing to a nationwide rush for trucks.
- Inventory is supporting normal transport work. Domestic auto inventories increased modestly in August, while recent Ship.Cars marketplace data shows demand continuing to shift by distance and week rather than building into a broad freight surge.
- Carrier costs are becoming the stronger pricing story. Diesel rose from $5.599 per gallon on August 31 to $6.382 on September 28, sharply increasing one of the largest variable costs of moving a truck.
- Broader trucking prices have now turned higher too. Truck transportation PPI increased from 209.2 in July to 213.3 in August, strengthening the case for cost-supported carrier pricing that we identified as a possibility last month.
- For October, plan around steady freight with less forgiving trip economics. Capacity may still be available, but long-haul, imbalanced, and hard-to-cover moves can remain expensive when fuel and other operating costs are elevated.
In this article
October Market Read: costs and prices are moving up together
In last month’s Auto Freight Economy market read, we highlighted an unusual split in the market. Diesel was climbing sharply while broader truck transportation prices were moving lower. Carriers were paying more to operate their trucks without clear evidence that the broader freight market would allow them to pass those higher costs through.
We said that if truck transportation pricing turned higher while diesel remained elevated, the case for broader cost-supported transport pricing would become stronger.
September brought exactly that combination.
Diesel continued climbing through the month, reaching $6.382 per gallon on September 28. At the same time, the Producer Price Index for truck transportation increased from 209.2 in July to 213.3 in August.
What makes that change important is what did not happen alongside it.
Vehicle sales remain healthy and inventory continues to create regular transportation work, but neither the monthly public data nor more recent Ship.Cars marketplace activity points to a nationwide freight surge.
The October story is therefore less about more freight competing for trucks and more about what it costs carriers to move the freight already available. Demand is holding, but the economics of covering individual loads have become less forgiving.
Are vehicle sales and inventory pointing to more freight?
The latest available monthly public data gives us a relatively stable demand baseline.
Total U.S. vehicle sales increased from 16.580 million SAAR in July to 16.982 million in August. That is enough to support consistent vehicle transportation demand, dealer activity, and broker volume without indicating a major acceleration in freight.
Domestic-auto retail sales moved slightly in the opposite direction, declining from 153.1 thousand units in July to 150.7 thousand in August. That makes it harder to interpret stronger overall vehicle sales as the beginning of a broad increase in domestic plant-to-dealer transportation.
Inventory also rebuilt modestly. Domestic auto inventories increased from 180.6 thousand units in July to 187.1 thousand in August, while the inventory-to-sales ratio rose from 1.180 months to 1.242 months.
Supply has loosened somewhat relative to sales, but those readings still do not suggest widespread oversupply or an urgent need to clear dealer lots. The more likely transport work remains familiar: restocking lots, transferring vehicles between locations, moving auction inventory, and positioning vehicles where they are needed.
More recent Ship.Cars Weekly Pulse data adds another layer to that picture.
During the September 7–13 holiday week, auto transport demand dropped and rates eased. The following week brought a broad post-holiday rebound. By September 21–27, however, cross-country volume had fallen again while capacity opened up.
Rather than building steadily toward a nationwide freight surge, September showed a market that continued to shift by week, distance, and lane.
There is freight to move. The demand picture simply does not explain the full pricing story.
Why are auto transport prices staying firm if freight isn’t surging?
This is where October looks different.
The U.S. diesel sales price climbed from $5.599 per gallon on August 31 to $6.382 on September 28. For a car hauler, that increase directly raises the cost of operating the truck.
And fuel costs are not limited to the loaded miles a customer sees on a quote. A carrier may need to drive empty to the pickup, cover additional miles because of the route, and travel again after delivery before finding the next load. As diesel becomes more expensive, every one of those miles costs more.
That does not automatically translate into higher rates across the board. A balanced regional lane with good carrier availability and plenty of follow-up freight can still attract strong competition. The pressure becomes harder to absorb on long-haul moves, rural pickups and deliveries, imbalanced lanes, and routes that leave the truck far from its next useful load.
The change in broader truck transportation pricing strengthens that story.
The Producer Price Index for truck transportation increased from 209.2 in July to 213.3 in August. Last month, rising diesel was squeezing carriers while the broader trucking-pricing signal was moving lower. That made it harder to pass higher operating costs through to the market.
In August, that second signal changed direction.
Truck transportation prices rose while fuel remained expensive, suggesting that higher operating costs now have more support in the broader pricing environment. For auto transport carriers, that creates more room to hold firm on rates where the economics of the trip require it, even without a major increase in freight demand.
Capacity can therefore remain available without becoming inexpensive. A truck may be nearby and technically able to take the shipment, but the carrier can still reject the load if the offered rate does not cover fuel, empty miles, and where the truck will end up after delivery.
What this means for auto logistics
For carriers working primarily in the spot market, October puts more weight on trip economics and margin control. Freight demand is not strong enough to give carriers unlimited pricing leverage, but higher fuel costs also leave less room to accept rates that do not cover the full move.
That makes the entire trip more important than the loaded rate alone. Truck position before pickup, empty miles, destination market, and the likelihood of finding the next load all affect what a workable rate looks like.
Contract freight creates a different challenge. Carriers already committed to fixed rates may have less ability to respond immediately when fuel costs rise. Unless the agreement includes a fuel surcharge or another mechanism that adjusts for changing operating costs, a sudden increase in diesel can come directly out of the carrier’s margin.
For brokers and shippers, quote age becomes more important when fuel is moving quickly. Vehicle transport may be priced days or weeks before the vehicle is actually ready to move. A quote created under a different fuel environment may no longer match the rates carriers are willing to accept when the load reaches the market.
That gap can appear as thinner broker margins, re-quotes, rejected offers, or longer cover times.
For dispatch and capacity planning, the better assumption is steady freight with greater cost sensitivity, not a sudden shortage of trucks. Available capacity and affordable capacity are not always the same thing. A carrier declining a load may simply mean that the offered rate no longer works once the full trip is considered.
The practical October read is therefore not to expect higher rates everywhere. It is to expect more variation between easy and difficult freight. Balanced lanes with good truck depth may remain competitive, while long-haul, imbalanced, rural, or otherwise inefficient moves give carriers more reason to hold firm when fuel remains expensive.
What to watch next month
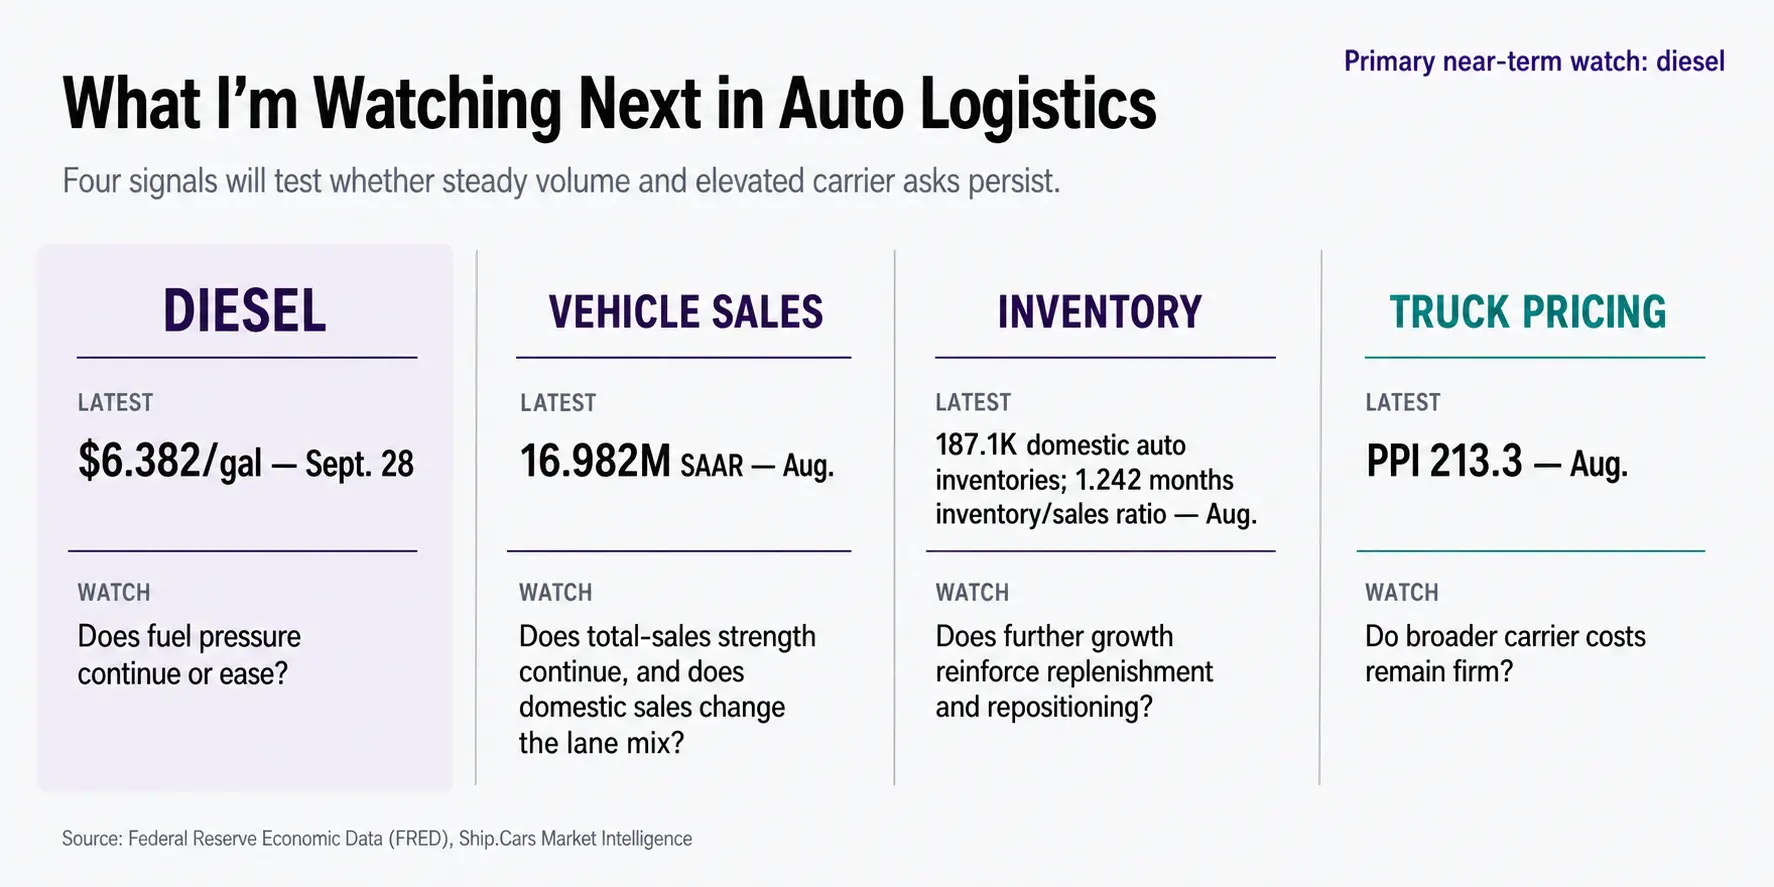
Diesel remains the first signal to watch. September confirmed the fuel-cost risk identified in the previous edition. If diesel remains near current levels or moves higher again, long-haul and inefficient routes should remain under the most pressure. A meaningful decline would give carriers more room on fuel, although it would not automatically translate into lower transport rates.
Truck transportation pricing is now equally important, although one higher monthly reading is not enough to establish a lasting trend. Another increase would provide stronger evidence that broader transportation pricing is adjusting to the higher-cost environment. A reversal would bring back some of the tension we saw last month: expensive fuel without the same support from broader trucking prices.
Vehicle sales and inventory will show whether the demand side changes the equation. Continued sales around current levels would support the steady-demand read. A stronger increase in sales combined with tighter capacity would introduce a different source of pricing pressure, while weaker sales would make carrier costs even more central to the market story.
For now, October begins with a relatively clear split: there is enough freight to keep vehicles moving, but not enough evidence of a demand surge to explain firm pricing on its own. Higher operating costs are doing more of that work.
Methodology note: This market read is based on publicly available economic and transportation indicators from the Federal Reserve Economic Data (FRED) database, including Total Vehicle Sales, Domestic Auto Inventories, U.S. Diesel Sales Price, Auto Inventory/Sales Ratio, Motor Vehicle Retail Sales: Domestic Autos, and the Producer Price Index for Truck Transportation.
Ship.Cars interprets these public signals through the lens of auto logistics. The analysis is intended as directional context for pricing and planning, not as a guarantee of future market conditions.